Hartford sits at roughly 59 feet above sea level, right where the Connecticut River carved a wide alluvial floodplain through central Connecticut. That low elevation and the glacial history of the region mean the soil profile here rarely follows a single rule: you find pockets of fine varved clay left by Lake Hitchcock layered between silty terraces and coarse outwash from the last retreat of the Laurentide ice sheet. When a contractor calls us about a site on Albany Avenue or near the old Colt complex, the first question is usually whether the material on site drains well enough to support a foundation without costly overexcavation. A proper grain size analysis with both sieves and hydrometer, run per ASTM D2487 and D422, gives us that answer in numbers, not guesses. For deeper exploration, we often pair it with an SPT drilling program to correlate the gradation curve with measured blow counts and stratigraphy.
A single hydrometer reading taken at the right time can save a project from a season of subgrade pumping and cracked slabs.
Quick answers
What does a grain size analysis cost in Hartford?
For a standard sieve plus hydrometer analysis in our Hartford-area lab, the fee typically falls between US$100 and US$190 per sample, depending on whether we run the full hydrometer sedimentation series or just a single-point check. Turnaround time and report detail are the same regardless.
When is the hydrometer portion necessary?
Any time the material passing the No. 200 sieve exceeds five to ten percent by weight, a sieve-only report stops being reliable for classification. Hartford's varved clays and silty floodplain soils almost always cross that threshold, so the hydrometer analysis becomes the only way to assign a correct USCS group symbol and anticipate drainage behavior.
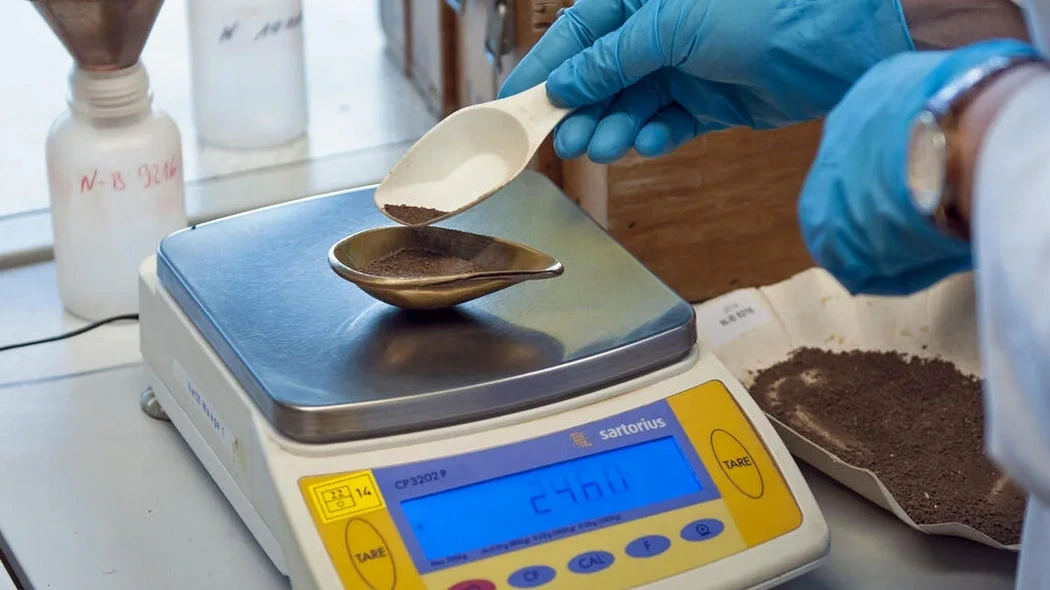
How do you sample material for grain size testing?
We obtain disturbed samples from test pits, split-spoon samplers during SPT drilling, or bag samples from stockpiles and borrow sources. The key is to collect enough material — roughly a one-gallon bag for silty soils and a larger sample if gravel is present — and to seal the bag immediately so the natural moisture content is preserved for the initial lab intake.
What does the gradation curve tell an engineer?
The semi-log plot shows the distribution of particle sizes across gravel, sand, silt, and clay fractions. From that curve we extract D10, D30, and D60 values to calculate the uniformity coefficient and coefficient of curvature, which together indicate whether the soil is well-graded or poorly graded. That classification directly feeds into compaction specifications, permeability estimates, and frost-susceptibility assessments under Connecticut's freeze-thaw cycles.